DOUBLE MASS CURVE
Double mass curve analysis is used for checking the consistency of the rainfall record of a particular raingauge station. If the conditions at a particular raingauge station change significantly, during the period of record, the rainfall data of that station is inconsistent.
Some of the common causes of the changes in conditions are as follows :
1) Shifting of the raingauge station from one place to the other.
2) Replacement of the old instrument with a new one.
3) Change of the observer or change in the method of observation.
4) Changes in the ecosystem near the station, such as forest fire, land slide, new construction, etc.
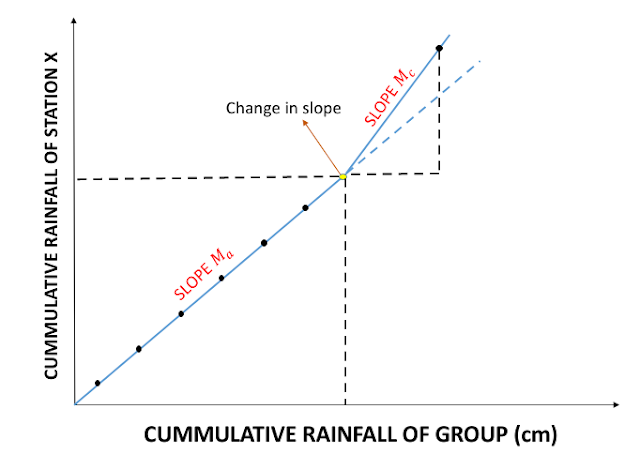
In the double mass analysis, the consistency of the data of the affected station X is checked by comparing its cumulative rainfall with the cumulative rainfall of a group of surrounding stations.
For analysis, at least ten such stations are selected. The cumulative values of the mean annual rainfall of the station X and that of the group of stations are calculated from the given rainfall data.
A graph is plotted between the cumulative rainfall of station X as ordinate and the cumulative rainfall of the group of stations as abscissa.
The curve is usually plotted starting from the latest record which is assumed to be correct.
The curve is called the double mass curve.
The corrected mean annual rainfall of station X is computed as follows :
Corrected mean annual rainfall =
(Corrected Slope/Original Slope) * Observed Rainfall


