INTENSITY-DURATION CURVE
It has been observed in practice that the greater is the intensity of rainfall, the shorter is the duration of the rainfall.
In other words, very intense storms occur for a short duration, and as the duration of a storm increases, its intensity decreases.
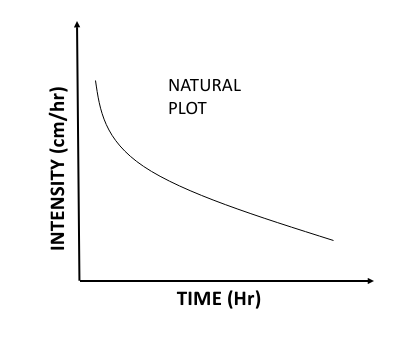
The intensity-duration curve can be obtained by plotting the rainfall intensity against duration of the storm.
The rainfall intensity is usually expressed in cm/hour and the duration is in minutes (or hours).
The curve is usually drawn on a natural graph paper.
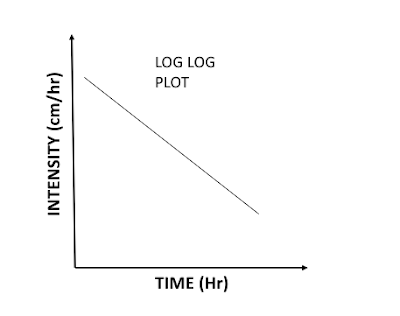
Sometimes, it is drawn on a log-log paper.
For plotting an intensity duration curve, the observed maximum rainfall intensities at a place for storms of different durations are obtained from the available rainfall record.
While selecting the storms of different maximum intensity, the following points should be kept in mind :
1) The severest storm of longer duration need not include the severest storm of shorter duration.
For example, the storm in which the maximum rainfall intensity for 10 minute duration occurs may not be the same storm in which the maximum rainfall intensity for 5 minute duration occurs.
2) Even for the same storm, the maximum rainfall intensity for 5 minute duration and that for 10 minute duration may not be successive.
For example, he maximum rainfall intensity for 5 minute duration may be from 8:00 AM to 8:05 AM, whereas that for 10 minute duration may be from 8:20 to 8:30 AM.
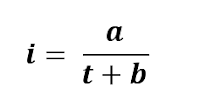
As the rainfall intensity (i) varies inversely with the duration (t), the relation between the two can be expressed by Talbot’s formula:
where a and b are constants. The Talbot formula is applicable for storms of duration 5 to 120 minutes. For storms of duration longer than 2 hours, the Sherman formula is commonly used. According to this formula,
where n is a constant.
Sometimes, the following alternative formula is used :
where k is a constant.
The values of the constants a, b, k and n for the given catchment are usually determine plotting the given data on a log-log plot.
The plot is usually in the form of a straight line. For accurate values, the theory of least squares is used.
INTENSITY-DURATION-FREQUENCY CURVES
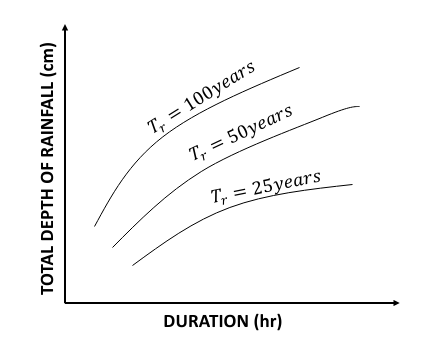
The intensity-duration curves for storms of different recurrence intervals are different.
A storm of any given duration will have higher intensity if its recurrence interval is large or the frequency is low.
In other words, for a given duration, the storms of higher intensity are rarer than the storm of smaller intensity.
Figure shows the intensity-duration-frequency curves for three different recurrence intervals.
For plotting these curves, the rainfall data is collected for a number of years.
By the probability analysis, the storms of different recurrence intervals such as 5 years, 10 years and 20 years are determined.
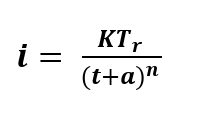
The relationship between the rainfall intensity (i), duration (t) and the recurrence interval (Tr ) can be expressed as :
where K, a, b and n are constants for the catchment area. The values of these determined from the rainfall data.

