AVERAGE RAINFALL DEPTH OVER AN AREA
The rainfall recorded by a raingauge represents the rainfall at that station. It is also called the point rainfall.
In many hydrological studies, the average depth of rainfall over a specified area a storm, or due to a number of storms, is required.
For determination of the average precipitation of an area, a large number of rain gauges are installed.
The average rainfall over the area is found the rainfall data of these rain gauges by one of the following three methods :
1) Arithmetic Mean Method :
If the country is flat and the gauges are uniformly distributed over the area, the rainfall of the individual stations does not show much variation from the mean precipitation of the area.
In the arithmetic mean method, the average depth of rainfall (P) over an area is taken as the arithmetic mean of the rainfall depths of all the stations.
It is obtained by dividing the sum of the depths of rainfall recorded at all the rain gauge stations by the number of stations. Thus
where P1, P2 , … , Pn are the depths of rainfall recorded at the rain gauge 1, 2, ….n. This methods does not give accurate results and hence is rarely used in practice.
2) Thiessen polygon method :
In the Thiessen polygon method, the rainfall recorded at each rai gauge station is given a weightage on the basis of the area which it represents.
This method is better than the arithmetic mean method which gives equal weightage to all the stations.
The following procedure is used :
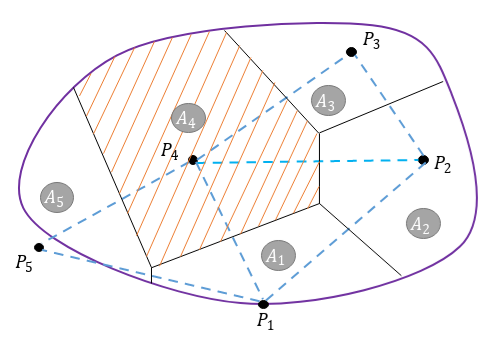
(i) The positions of the rain gauge stations are marked on the plan of the catchment area over which the average rainfall depth is required.
(ii) The adjacent rain gauge stations are then joined by straight lines; thus the entire area is divided into a series of triangles. The rain gauge stations which are outside the catchment area but are in its neighbourhood should also be considered.
(iii) Perpendicular bisectors are then drawn on the connecting lines to form polygons around stations. Each polygon contains only one rain gauge station. The entire area of a particular polygon is nearer to the rain gauge station contained therein than to any other rain gauge station. Thus each polygon represents the area of the influence of that rain gauge station.
(iv) For determination of the average depth of rainfall, the boundary of the catchment is taken as the outer limit of the Thiessen polygons. The areas of the polygons are determined either with a planimeter or with an overlay grid.
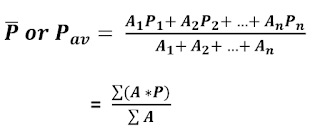
(v) The average precipitation of the area is given by
where A1, A2 , … , An are the areas of the Thiessen polygons representing the stations 1, 2, …n and P1, P2 , … , Pn are the corresponding precipitations, and A is the total area.
3) Isohyetal Map Method :
Isohyets are the contours of equal rainfall depth.
For plotting of an isohyetal map, rain gauge stations are marked on the plan of the catchment.
The rainfall recorded at these stations is also marked on the plan.
The rain gauge stations located outside the catchment but in its neighbourhood are also marked.
The isohyets of various rain fall depths are then drawn by interpolating the values of the rainfall.
Generally, a linear variation of rain fall depth is assumed between the two rain gauge stations.
For the determination of the average rainfall depth, the catchment area between adjacent isohyets are measured.
The catchment boundary is taken as the extreme limit of the areas.
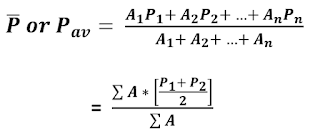
The average depth of the rainfall of an area between two adjacent isohyets is usually taken equal to the mean of the two isohyet values.
For the area between the last isohyet and the boundary of the catchment, a suitable value of the average depth should be taken, depending upon the distance of the outside isohyet and the actual boundary.
The average depth of the rainfall of the entire catchment is given by
The isohyetal map method is the most accurate method.
In this method, all the relevant data is fully utilized and properly interpreted.
Moreover, the method can be used to make adjustments for variations in altitudes of the stations due to orographic influences.
Hence while constructing the isohyetal map for a hilly region, the interpolation between gauge stations can be done according to the difference in elevations of two stations, and not according to the distance between them.
This is more logical because the precipitation generally depends upon the altitude.
However, the method has disadvantage that it is laborious and not easily adaptable to a computer.


